Convective sweepers of the Asian monsoons
Charles Warner 1 Feb 2013
Collected here are views from 5 and 7 July 1979 of the depression
observed during the Summer Monsoon Experiment. Published observations include those by
Warner (1984), Warner and Grumm (1984), Michael W. Douglas (Mon. Wea. Rev.,
Aug 1992, 120, 1524-64) and Houze and Churchill (JAS, 15 July 1987, 44, 1845-67).
Warner references are given fully in my curriculum vitae
(back to main page).
Here are shown
Southbound/northbound traverses on 5 July 1979
Southeast of the center on 7 July 1979. Also featured are
Detailed observations on GATE day 261
The Winter Monsoon Experiment, 12 December 1978
Concluding discussion
Southbound/northbound traverses on 5 July 1979
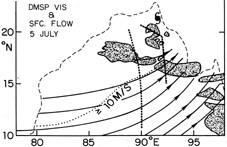
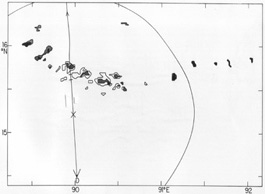
1022 local time, 5 July 1979. Surface chart showing the northern Bay of Bengal, the coastline of which
is shown dashed. The hatched areas are from the Defense Meteorology Satellite Program VIS image as seen below.
Streamlines of surface flow are shown with arrows; a thin dotted isotach marks the northern boundary
for winds exceeding 10 m/s. Southbound and northbound heavy dotted lines are parts of the track of
the NOAA WP3D aircraft. A cyclone symbol marks the center of circulation at 700 hPa just off the coastline.
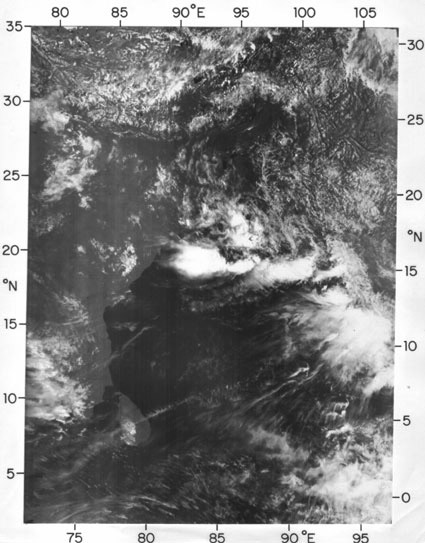
1022 local time, 5 July. DMSP VIS image
(Compare Richard Scorer, Cloud Investigation by Satellite,
Ellis Horwood, 1986)
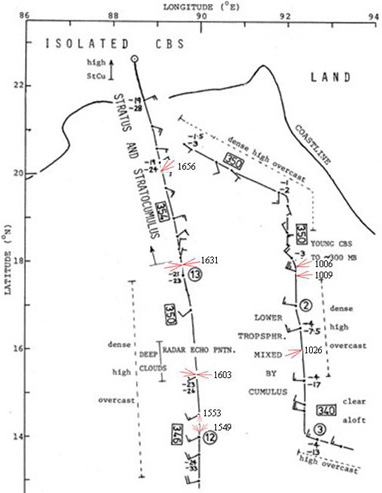
5 July 1979. Track of WP3D aircraft outbound from Calcutta at about 500 hPa (right, 10 local time)
and returning at 330 hPa (left, 16 local time). Winds are instantaneous flight level readings (1 barb = 5 m/s).
Pairs of temperature and dew point readings are shown, and representative values of θE [K] in boxes.
Circled numbers refer to dropwindsondes. Notes on clouds added.
Click on times shown to see airborne photos as indicated by red arrows.
1006 local time. 92.1E, 17.9N, 483 hPa. On the east flank of the large
formation advancing southwards.
Clouds near the surface were symptomatic of
unstable stratification and ascent, rather than cold downdrafts.
(back to index)
1009 local time. 92.2E, 17.7N, 483 hPa: Photos shown at B in the 1026
radar map below.
The clouds grew into the mapped location between 1009-26.
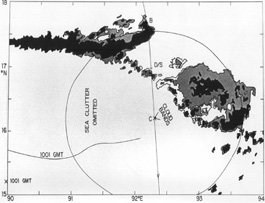
1026 local time. Radar echoes from the W3PD. The range at 150 km from the
aircraft is shown. The labels 1001 UTC refer to the position of the aircraft and of the line of radar
echoes at 1601 local time, 5.6 hours later. The velocity of propagation was 9.3 m/s southwards,
unlike any winds in the vicinity, but comparable to the speeds of similar formations found by Zuidema
(Mon. Wea. Rev., May 2003, 131, p 780-98) and Houze (Rev. Geophys., 42, Dec 2004).
(bacmap) [
photo from GATE day 261].
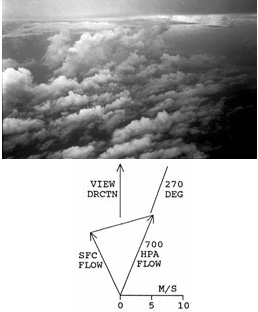
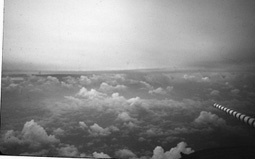
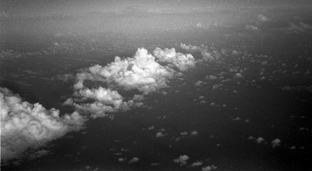
1026 local time. Looking on azimuth 070° from location C on the radar map, distant 200 km west from the coast of Rangoon.
The wind velocities at the surface and at 700 hPa are shown, and the shear between them, along which the
cloud bands were aligned. Bands of clouds such as these are rare. The flow was coming up against the coast,
and the bands suggest waves of compression apparently like those shown in the
photo from GATE day 261.
(bacmap)
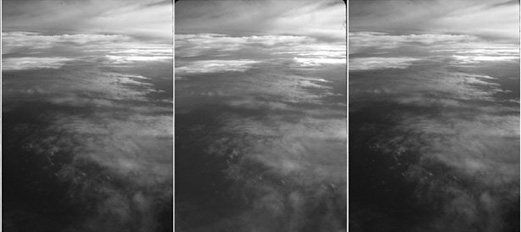
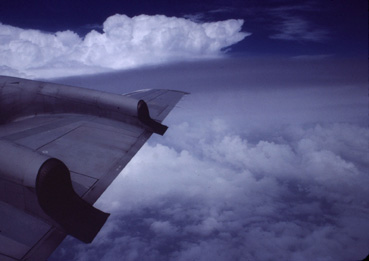
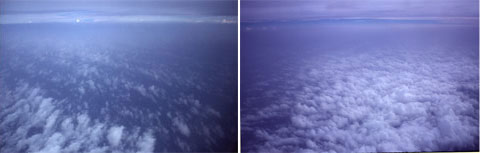
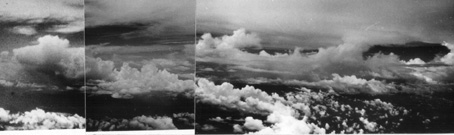
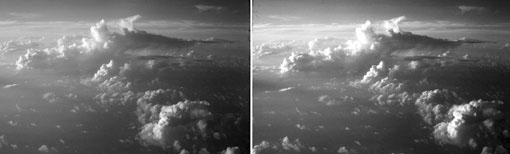
1656 local time. Looking on 230°
This stereo-pair is presented as left-eye, right-eye, left-eye views for relaxed, or cross-eye, viewing.
Thin cloud layers occurred near the surface, not far below flight level, and at two levels above flight level.
Implied is an absence of marked vertical motions in the air behind the southward-moving cloud line.
1631 local time. On 260°
On 080°
(bacmap)
Behind the cloud line an absence of strong vertical motions is suggested.
1603 local time. On 270°
On 100° (bacmap)
Close to the position of the cloud line, these two views show cumulus of size up to congestus;
there was no stratus seen below flight level.
1601 local time. Radar echoes from the W3PD, as above.
Three short lines identify intense updraughts; the middle one reached 15.7 m/s.
Compare this map with the radar map for 1026 local time, above.
(bacmap)
1553 local time. Photo looking N from location D shown above. Small cumulus clouds are shown,
symptomatic of unstable stratification near the surface,
below a forward overhang of dense high overcast.
(back to index)
1549 local time. On 135° (SE)
On 225° (SW)
These views look into the environment into which the cloud line was advancing.
There were fluxes off the surface, shown by high densities of small cumulus.
Those seen to the SE, on 135°, were narrow and based above the surface -
symptomatic of unstable stratification and an absence of subsidence.
An absence of marked vertical motions through most of the troposphere is suggested.
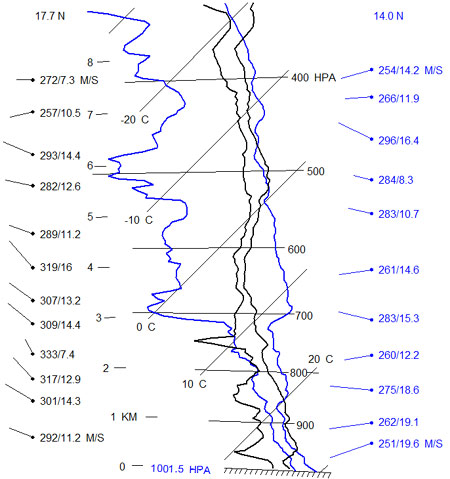
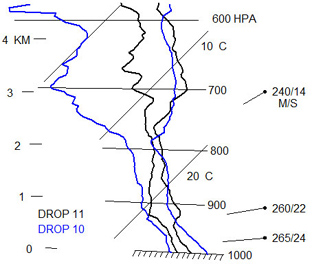
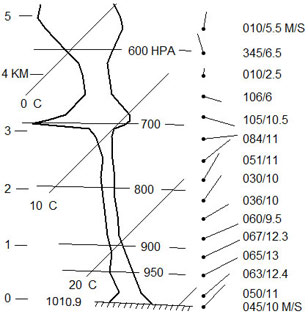
5 July. Tephigrams of temperature and dew point, and winds, from dropwindsondes released at
1548 local time, 90.0°E, 14.0°N, 327 hPa (right, blue) in front of cloud line advancing southwards and
1629 local time, 89.7°E, 17.7°N, 326 hPa (left, black) behind the advancing cloud line.
First a dry upper troposphere was found into which the convective lines were advancing.
Note the low-level meridional confluence in velocity v shown by the winds near the surface.
After passage of the convective lines the upper troposphere was moist and low levels showed
signs of downdraughts. These soundings resemble those from Drops 10 and 11 on 7 July, shown below.
(back)
Southeast of the center on 7 July 1979
Two days after flying southward through the cloud lines of 5 July, the depression was examined
at its mature stage on 7 July. Extensive treatment of this day was given by Warner (1984) and
Warner and Grumm (1984, WG84). A line of clouds propagating from 255° at 24 m/s was documented.
This is shown below.
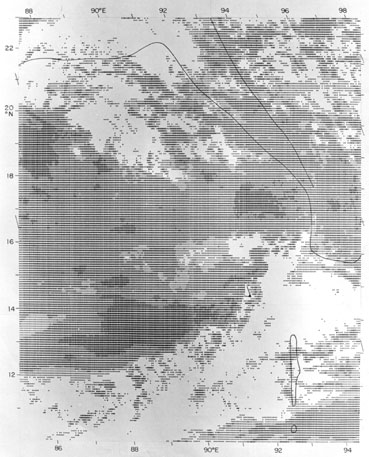 1336 local time, 7 July 1979. Map of visible brightness from the satellite GOES-1. The field of view of the
photo below at 14.5%deg;N, 92%deg;E is shown. Thick outlines represent the coast of the Bay of Bengal,
the ridge line of the Arakan mountains about 100 km NE of the coast, and the Andaman Islands near 12N.
Centres of circulation of the depression were near 88°E, 19°N, near the top left of this view.
1336 local time, 7 July 1979. Map of visible brightness from the satellite GOES-1. The field of view of the
photo below at 14.5%deg;N, 92%deg;E is shown. Thick outlines represent the coast of the Bay of Bengal,
the ridge line of the Arakan mountains about 100 km NE of the coast, and the Andaman Islands near 12N.
Centres of circulation of the depression were near 88°E, 19°N, near the top left of this view.
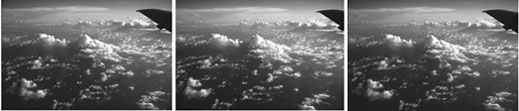
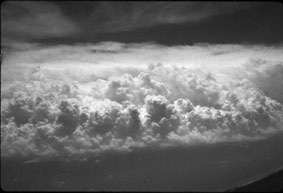 1325 local time, 7 July 1979. Photo by Elford G. Astling from 92.0°E, 14.5°N, 468 hPa, looking northwestward.
The field of view is shown above in the visible satellite image. The cloud line was advancing eastward fast.
WG84 reported that discrete propagation was a feature of this line, new growth occurring
out in advance of existing clouds. Houze (2004) gave a comprehensive review of this phenomenon.
He reported its occurrence in cases like the line seen here on 5 July.
1325 local time, 7 July 1979. Photo by Elford G. Astling from 92.0°E, 14.5°N, 468 hPa, looking northwestward.
The field of view is shown above in the visible satellite image. The cloud line was advancing eastward fast.
WG84 reported that discrete propagation was a feature of this line, new growth occurring
out in advance of existing clouds. Houze (2004) gave a comprehensive review of this phenomenon.
He reported its occurrence in cases like the line seen here on 5 July.
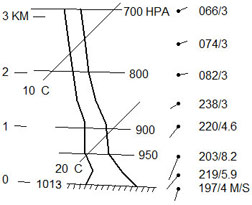
 7 July. Tephigrams from dropwindsondes released at
1319 local time, 91.9°E, 14.2°N, 483 hPa
(Drop 10, blue) and 1348 local time, 92.0°E, 16.5°N, 462 hPa (Drop 11, black).
The drier air aloft was south of the clouds of the depression, as on 5 July. This diagram follows Fig. 18b of WG84.
Three wind barbs have been added to the tephigrams, intended to be represent the winds driving the cloud line.
The photo indicates that there was a maximum of wind speed at cloud base, and the speed was probably close to
the measured speed of propagation, 24 m/s. The three winds shown are consistent with the measured winds presented by
WG84; here it is suggested that a maximum occurred at the leading edge of the cloud line just above the surface.
On 5 July the advancing cloud line was evidently like those documented by Zuidema (2003) and Houze (2004).
Through the time of Johnson and Houze (1987, Monsoon Meteorology, Chapter 10, Chang and Krishnamurti, Eds., OUP),
until quite recently, we have not realized that this cloud line was closely related to the convection treated
by B. E. Mapes, T. T. Warner, Mei Xu and A. J. Negri in the trio of papers published in
Mon. Wea. Rev., May 2003, 131, 799-844.
On 7 July this line occurred in a location quite similar to the lines of 5 July,
but the propagation was eastwards in the strong westerly winds to the southeast of the centre.
The data implied the occurrence of ducting related to the low-level stable layer seen in drop 11 of 7 July,
capping instability close to the surface.
(back)
Detailed observations on GATE day 261
We perceive pulses of convective heating. Detailed GATE observations were described by Warner et al. (1979).
The mesoscale arc shown below was one of several moving roughly northwards to northeastwards in convergent
low-level flow entering the area of a cluster of cumulonimbus. These formations were observed in
visible satellite imagery. Each could be followed for about an hour. The view shown below is from Warner
(1978), where details are given from photogrammetry.
1522 UTC, 18 Sep 1974. Composite of photos by Joanne Simpson
looking north from 9.9°N, 21.8°W
at altitude 5.7 km on day 261 of the GATE experiment.
Leading this cloud formation (to the east or right in the view) there were small cumulus fractus in rows
suggestive of waves of compression. They extended for about 10 km in advance of the main arc.
(Compare the photo taken at
1026 on 5 July .)
These little clouds were narrow and grew vigorously - indicating shallow cloud roots
in unstable stratification of the air at low levels ahead of the arc.
Areas per cloud of these cumulus fractus were ~ 1 to 4 km².
Following Warner et al. (1979), an appropriate sounding is shown below:
 Cloud base was at about 950 hPa, where a maximum of wind was measured. The cloud arc moved slightly faster than the wind.
Ascent was concentrated in the narrow arc of cumulus mediocris. The highest of these mediocris reached altitude 2.7 km.
(The cumulus tower seen to the left in the view was at altitude 9.1 km.)
The mediocris were tilted at about 60° to the vertical. From direct measurements as
well as photogrammetry, we know that vertical velocities in tropical oceanic cumulus mediocris at the altitudes
shown here are ~2.5 m/s (Warner and McNamara 1984). After the work of Malkus
(QJRMS, 1952, 78, 530-42), consistency is found between the magnitude of the wind shear
and this vertical velocity.
Cloud base was at about 950 hPa, where a maximum of wind was measured. The cloud arc moved slightly faster than the wind.
Ascent was concentrated in the narrow arc of cumulus mediocris. The highest of these mediocris reached altitude 2.7 km.
(The cumulus tower seen to the left in the view was at altitude 9.1 km.)
The mediocris were tilted at about 60° to the vertical. From direct measurements as
well as photogrammetry, we know that vertical velocities in tropical oceanic cumulus mediocris at the altitudes
shown here are ~2.5 m/s (Warner and McNamara 1984). After the work of Malkus
(QJRMS, 1952, 78, 530-42), consistency is found between the magnitude of the wind shear
and this vertical velocity.
Behind the arc the air near the surface was clear. This suggests subsidence compensating the strong ascent
in the line of cumulus. The extent of the subsidence was several tens of kilometers.
Warner et al (1979) found that there was no gust front from cold air near the surface.
(back)
The Winter Monsoon Experiment, 12 December 1978
One further case will be included here. Warner (1982) described mesoscale features and cloud organization
on 10-12 Dec 1978 over the South China Sea during the Winter Monsoon Experiment.
[This paper is incorrect in that the data on cloud streets are not inconsistent with inflection point
instability (Brown 1970).] The following photograph shows an arc of clouds in the northeast monsoon flow towards the
equatorial trough zone at latitude 9.4°N.
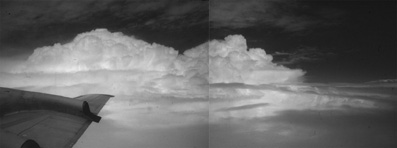
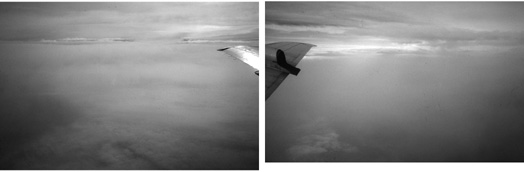
1632 local time, 12 Dec 78. Stereo-pair of photos looking towards 160° from 9.4°N, 114.7°E
at altitude 7.8 km
(from Warner 1982) (compare
1448 and/or
1538 in page2.)
It was one of many such arcs which populated this flow. The leading edge of this arc - facing away from the camera -
is not clearly seen here, so a second photo is shown, which shows a cross-wind line close to or identical
with the distant line partly obscured by the wing of the aircraft in the first picture.
1653 local time, 12 Dec 78. Looking towards 080° from 8.6°N, 114.2°E at altitude 7.8 km
This photo was taken 100 km SSW, downstream, and 21 min after the above.
Just ahead of the line a band a few kilometres wide was relatively free of tiny cumulus.
Data from a local dropwindsonde are shown in the following tephigram launched at 1651 local time,
8.8°N, 114.4°E.
 Shallow cumulus led the arc seen in the first photo. They increased in size rearwards. The maximum heights
were probably ~2.5 to 3 km, close below the dry layer seen in the tephigram. Clear air lay beneath the
highest tops of the cumulus mediocris: there were few if any tiny cumulus there, in marked contrast to
the lines of tiny cumulus oriented approximately along the direction of flow close to the surface.
The stereo-pair shows very small patches of stratus at a level below that of the highest cumulus mediocris.
The photos suggest a maximum of wind speed at levels close to cloud base. Synoptic studies at the University
of Virginia by R. H. Simpson et al. have filled in the picture of winds.
Shallow cumulus led the arc seen in the first photo. They increased in size rearwards. The maximum heights
were probably ~2.5 to 3 km, close below the dry layer seen in the tephigram. Clear air lay beneath the
highest tops of the cumulus mediocris: there were few if any tiny cumulus there, in marked contrast to
the lines of tiny cumulus oriented approximately along the direction of flow close to the surface.
The stereo-pair shows very small patches of stratus at a level below that of the highest cumulus mediocris.
The photos suggest a maximum of wind speed at levels close to cloud base. Synoptic studies at the University
of Virginia by R. H. Simpson et al. have filled in the picture of winds.
On synoptic scale the low-level winds did not in general show gradual changes downstream.
Low-level data from the Electra research aircraft on this day showed the presence of isolated speed maxima
rather than gradual acceleration. The speed maxima were local. A local speed maximum at cloud base would
accompany a horizontal vortex line with an axis somewhere above cloud base. Such a feature is compatible
with the photographic evidence.
Convection gradually deepens as winter monsoon flow approaches the equatorial trough (Warner 1982),
and a stereo-pair taken further downstream is shown below.
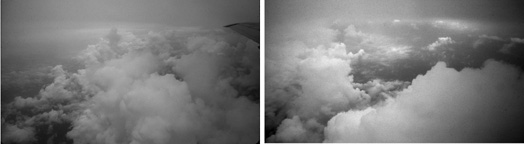
1704 local time, 12 Dec 78. Looking towards 310° from 7.7°N, 113.7°E at altitude 7.8 km
The full range of sizes of cumulus is shown here. Was there a wind maximum near cloud base? Yes.
The smallest cumulus tilted to the left in this view (looking NW); cumulus humilis tilted to the right,
and some small cumulus had the shape of a bow. If cloud base is taken as 500 m, and the dimension of
cumulus fractus as ~100 m, then the altitude of the wind maximum was ~900 m. Vertical velocities in
the small cumulus of ~2.5 m/s would then be consistent with the winds presented above in the tephigram.
The large dissipating cumulonimbus seen in the middle of the stereo featured an anvil trailing behind it.
Streamers of precipitation fell from it; their slopes indicate that the northeast component of the wind
decreased with height. While the low-level northeasterly monsoon flow was strong, the flow aloft was light
and variable. (back to
main page) (back to web
design)
(back)
Concluding discussion
A variety of convective pulses has been shown in this study. Among theoretical treatments and simulations,
attention is drawn to the work of Emanuel (JAS, 15 Oct 1986, 43, 2183-98), a precursor to
section 11.3 of his classic book Atmospheric Convection (1994). He studied effects of precipitation. Dudhia,
Moncrieff and So (QJRMS, Jan 1987, 113, 121-46) presented a simulation with results similar to
these GATE and WMONEX studies, prominently featuring a concentrated updraft, and with a surface gust front absent.
T. T. Warner, Mapes and Xu (Mon. Wea. Rev., May 2003, 131, 813-29) employed the MM5 model to study the
convection they observed in the Panama Bight and vicinity. Discrete propagation over southern Britain was observed by
Morcrette, Browning, Blyth, Bozier, Clark, Ladd, Norton and Pavelin, and modelled by Marsham and Parker
(QJRMS, Apr 2006 B, 132, 1021-51; 1053-72). Bringing us up to date in this subject area,
Love, Matthews and Lister have studied the diurnal cycle of precipitation over the Maritime Continent
in a high-resolution atmospheric simulation (QJRMS, Apr 2011 B, 137, 934-47).
Essential ingredients for the lines appear to be the unstable stratification at low levels, and a wind maximum and
stable layer suitable to yield ducting as of a gravity wave. The presence of strong radiative forcing on cloud and haze at
altitudes near 500 m leads to stabilization (Mather, McFarlane, Miller and Johnson, 1 Mar 2007, JGR, 112;
Pakula and Stephens, 2009, JAS, 66, 62-76). The pulses shown here were not gravity waves: they were powered
by energy conversions in cumulus clouds. In view of their propensity to propagate through the marine boundary layer, it
seems appropriate to use the name "convective sweepers" for these pulses: they sweep up heat and moisture from the surface.
To complete a satisfactory modeling study, fallout and evaporation of precipitation from the cumulus mediocris should be
included, friction contributing to reduction of wind speeds near the surface, and probably
both long and short wave radiative fluxes. (back to
main page)